BEST MACD indicator trading strategies 2024
BEST MACD Trading Strategies
The MACD indicator strategy that we will explain is a popular strategy. You can use this strategy in various financial markets. This method is relatively easy to understand. In addition, this method can be applied to various market conditions, and most importantly has the potential to generate profits if used correctly.
MACD indicator
MACD (Moving Average Convergence Divergence) is one of the most popular and widely used technical indicators, both by experienced traders and beginners. Its use is to identify market trends using moving averages..
 |
| MACD indicator |
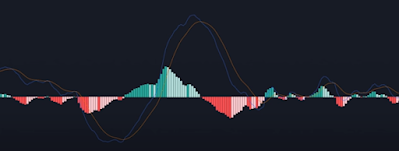
Adding the MACD indicator to the trading chart is just the first step. To truly exploit its potential in trading, it is important to understand how this indicator works. MACD consists of four main components, which we will discuss in order to interpret the signals produced.
- MACD line
- Signal line
- Histogram Line
- Zero line
- MACD Line: This line is usually blue and represents the average price movement over 12 periods.
- Signal Line: Usually orange, this line is the moving average of the MACD line itself, but over a longer period of time, namely 26 periods.
- Histogram: Colored bars showing the difference between the MACD line and the signal line. The closer together the two lines are, the shorter the histogram (and vice versa).
- Centerline (Zero Line): The horizontal line which is generally in the middle of the MACD chart, represents the zero point.
Looking for Trends with MACD: Reading Crossover Signals and Histograms
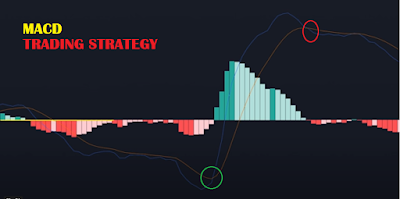
MACD and Signal Line Crossover:
- Upward Crossover: If the MACD line crosses above the signal line, this indicates a potential uptrend. This means that the momentum of price movements is strengthening upwards.
- Downward Crossover: On the other hand, if the MACD line crosses below the signal line, the trend will likely reverse to down. The momentum of price movements is weakening.
Histogram:
- Enlarged Histogram Bars: The higher and thicker the histogram bars, the stronger the momentum of the current trend, be it an uptrend or a downtrend.
- Shrinking Histogram Bars: Conversely, shorter and thinner histogram bars indicate weakening trend momentum.
Capturing Trends with MACD Indicator
The MACD (Moving Average Convergence Divergence) indicator is known for its ease of use. However, many traders are trapped in only using MACD. In fact, MACD's best performance appears when the trend is dominating the market.
For example, in an uptrend, MACD accurately predicts upward price movements. On the other hand, in a downtrend, MACD sometimes still gives a buy signal even though prices are falling.
Overcoming MACD False Signals
For example, if you are a long (buy) trader, then ideally you should only trade when the trend is up. Going against the trend is the same as going against the flow, and there is a high risk of experiencing losses.
Confirming Trends with the 200 Day Moving Average
The solution is easy: add a 200 day moving average indicator. By adding the 200 day moving average, you will only see one line on the chart, as in the following image.
If the price is above that line, it means that the market is in an uptrend. If the price is above or below that line, and vice versa, for example, the figure below is an uptrend and a downtrend.


Post a Comment for "BEST MACD indicator trading strategies 2024"