How to Trade Forex Using Bullish Homing Pigeon Candlestick Analysis
Candlestick Bullish Homing Pigeon
In this article, we will again discuss candlestick patterns, we will discuss how to trade forex using the analysis of the "Bullish Homing Pigeon" Candlestick. Here we will provide information on what the "Bullish Homing Pigeon" candlestick pattern looks like, and what the confirmation form of the "Bullish Homing Pigeon" candlestick pattern looks like when making a purchase in forex trading. Like the "Bullish Matching Low" candlestick pattern, the "Bullish Homing Pigeon" candlestick pattern also has a medium level of accuracy.
As we have often been reminded in several discussions about candlestick patterns that have medium accuracy, meaning we need to wait for confirmation before we take action to open a position. Of course, we can still act to open a position without having to wait for confirmation. However, the risk we will get is very large. So, in a case like this, we highly recommend waiting for confirmation first if we use a candlestick pattern that has a medium level of accuracy.
What is a Bullish Homing Pigeon Candlestick Pattern?
The "Bullish Homing Pigeon" candlestick pattern is a buy signal. The "Bullish Homing Pigeon" candlestick pattern tells us that the (Bearish) trend has ended. This means that the (Bullish) trend is starting. Of course, we as traders think that this is the most appropriate point for us to buy shares. To better understand it from the shape of the "Bullish Homing Pigeon" candlestick pattern, let's look at the image below together.
 |
| bullish homing pigeon candlestick |
On the first day, a long red candlestick pattern was formed. This means that the candle pattern tells us that the Bearish candlestick is still continuing its dominance. Up here we can predict that the Bearish candlestick will still dominate the price in the following days. (Fortunately) on the second day, a red candle with a short rod was formed. Then we can see from the picture above that the candlestick has an opening price that is lower than the opening price of the previous candlestick, and a higher closing price when compared to the candlestick on the first day.
This means that the candlestick on the second day tells us that initially, the Bullish candle dominated the price. They can push forward very far. Then there was resistance from the Bearish candle which forced the Bullish candle to retreat slightly. Here the Bearish candles are indeed the winners today, but it is clear that their strength is starting to weaken.
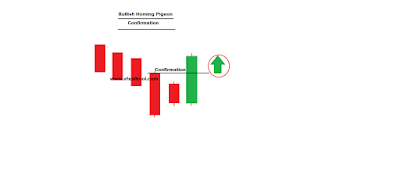
Meanwhile, it appears that the strength of the Bullish candle squad has strengthened very drastically. There is a possibility that in the following days the Bullish candle will reverse which dominates the price. However, this is still a possibility. As we said before, in this case, we should wait until confirmation is made that the Bullish candle has completely dominated the price. Let's look at the following image below.
Meanwhile, it appears that the strength of the Bullish candle squad has strengthened very drastically. There is a possibility that in the following days the Bullish candle will reverse which dominates the price. However, this is still a possibility. As we said before, in this case, we should wait until confirmation is made that the Bullish candle has completely dominated the price. Let's look at the following image below.
 |
| Bullish Homing Pigeon confirmation |
Post a Comment for "How to Trade Forex Using Bullish Homing Pigeon Candlestick Analysis"