Pocket Option Strategy Combining MACD and Stochastic For Entry - Binary Options
Pocket Option Strategy Options MACD And Stochastic Oscillator Best Indicators
Today is a very exciting day because here we can share back with you about the Pocket Option trading strategy. The strategy that we will share is a combination of two very popular indicators, namely the MACD indicator and the Stochastic Oscillator. This strategy is the best strategy choice, here We will explain a method that is very interesting and at the same time wise.
Be wise because if you dig deeper and study in detail the method we are going to share this will be one of the best for you and will increase your profitability. Before we share this method, it would be nice for you to see the reviews first Pocket Option platform.
Pocket Option Strategy Combination of MACD indicator and Stochastic Oscillator
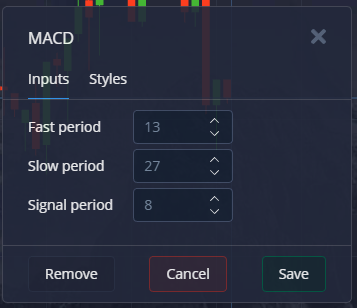
1. Select the MACD indicator
- Fast period 13
- Slow period 27
- signal period 8
 |
| MACD Indicator |
2. Select the Stochastic Oscillator indicator
Use the Candles chart type for 15 seconds. For trading the time you can use one-minute or two-minute intervals. Then you can also place a currency pair with a high percentage because this is very important to increase your income when it is profitable to make a purchase.
 |
| Type Chart 15 seconds |
If all of the MACD and stochastic indicator periods are by the predetermined trading timeframe, don't forget to see the timeframes. Because one of the main factors that must be considered when you run the Double Cross MACD and stochastic strategy is time frames.
How to Make a Purchase
Once you understand the main factors, now is the right time for you to learn how to take open positions.
True to the name "Double Cross", what you need are two crosses of the indicators involved, namely the MACD indicator and the Stochastic Oscillator. Therefore you have to pay close attention to the movements that occur in MACD and Stochastic. The following are examples of MACD applications and Stochastic Oscillator on the 15-second candle chart that was set earlier.
As you can see in the picture above, the Stochastic indicator has a display of two curve lines, while the MACD shows signal lines and bars histogram. Sometimes, there will be a crossing or a line crossing on MACD and stochastic.
How to Open a "Sell" Position During Bearish Reversal Conditions
Generally, in using this strategy we look for bullish reversal opportunities in the stock market. For clarity, consider the example graph below.
 |
| MACD and Stochastic Cross |
As you can see in the picture above, MACD and stochastic strategies are used to look for short positions during bearish reversal. On the previous chart, we see the price continues to rise in an uptrend position until it reaches its highest price. Meanwhile, a stochastic crossing occurred, and it was confirmed also by crossing MACD in the same direction. Even on the MACD histogram, we see that the price has changed from bullish (green bar line) to bearish (red bar).
How to Open a "Buy" Position During a Bearish Reversal
To take a long position, there are several conditions that we must fulfill. In addition to the Stochastic crossing, at almost the same time there should be a crossing signal line and MACD histogram upwards.
But what you have to remember, the MACD histogram signal must occur after the stochastic crossing.
If not, chances are the market will be sideways and you can get caught in the middle of price uncertainty.
MACD and stochastic indicators are two indicators that are quite popular among traders. Both are known to have a simple and easy-to-read display.
The purpose of using these indicators is to determine the direction of price movement as well as the strength of the trend. Both indicators will be very accurate if:
You combine it with trading signals.


Post a Comment for "Pocket Option Strategy Combining MACD and Stochastic For Entry - Binary Options"