Pocket Option Strategy 2024 - Binary Option Trading - Florida
Very Awesome Strategy For Pocket Option Binary Options Trading
In this article, I will share again a truly amazing trading strategy for Pocket Option binary options.
Also, in this article,,,, We will explain all the secrets and show you how to find a good entry point, and
good offer. So, I think it's a good time to start setting up some indicator options for using the right strategy
this is so amazing.
BOLLINGER BANDS INDICATORS
The Bollinger Band indicator can be used to measure volatility when the market is in a sideways condition. In addition, the Bollinger Bands indicator is one of the indicators that are very popular among traders to date. This Bollinger Bands indicator was created by John Bollinger, who was a technician trader in 1980. In addition to an indicator tool for measuring volatility, the Bollinger Bands indicator can also be used as an indicator tool to determine the direction of the trend of price movements when trading.
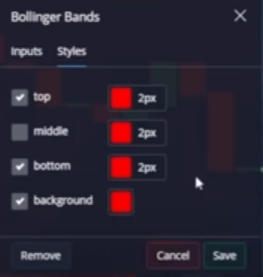
- Select and apply the Bollinger Bands indicator
- Period 20
- Deviation 2
- Color "adjust to your convenience in making trades"
- Middle "Specifically for this section do not check"
 |
| Bollinger Bands Indicators |
 |
| Bollinger Bands indicator style |
STOCHASTIC OSCILLATOR INDICATOR
To make our analysis stronger and more accurate, the Stochastic Oscillator indicator should apply next. The indicator is also a very popular indicator among traders. The Stochastic Oscillator indicator is an indicator for determining trend strength. The Stochastic Oscillator indicator was developed by George Lane in 1950. This indicator predicts over a period specified at the closing price during the period. For settings for the Stochastic Oscillator Indicator that must be changed in the strategy that we will share, please see the image below:
 |
| Stochastic Oscillator Indicators |
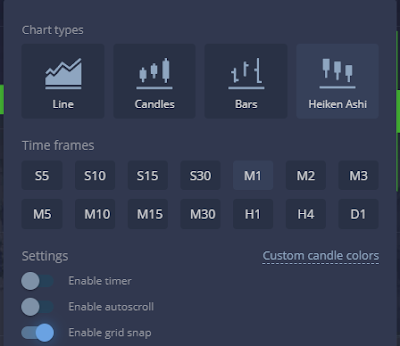
If the two indicators have been installed, and the period of each of the two indicators has been changed. The next step is to use the Heiken Ashi chart type, with 30-second time frames. Then for the duration of the trade choose 2 minutes.
 |
| Heiken Ashi Chart Type |
How to make a "LOWER" purchase
The best moments to make a "LOWER" buy using this strategy are: First the Stochastic Oscillator indicator must be in the position of buy and must intersect each other from the buy position. Then the price should stop moving along the upper line of the Bollinger bands indicator. This means it is a very clear trend reversal, as you can see in the image below.
How to make a "HIGHER" purchase
The way to make a HIGHER purchase is actually just the opposite of the way we analyze signals for a LOWER purchase. Stochastic Indicator Oscillators must be in short positions and must intersect each other from short positions. Then the price should stop moving along the line below the Bollinger bands indicator.
That's a very extraordinary strategy that I can share, hopefully, this strategy can help you trade in binary options.

Post a Comment for "Pocket Option Strategy 2024 - Binary Option Trading - Florida"