Forex Trading Strategy Using Bullish Harami Cross Candlestick Analysis
In the previous discussion, I shared a trading strategy using Bullish Engulfing candlestick analysis. The Bullish Harami Cross candlestick pattern also includes a price reversal signal, a price reversal signal from trend (Bearish) to trend (Bullish). The Bullish Harami Cross candlestick pattern has a high level of accuracy medium, which means that the next candlestick confirmation becomes something very important in using analysis Bullish Harami Cross candlestick in forex and binary options trading.
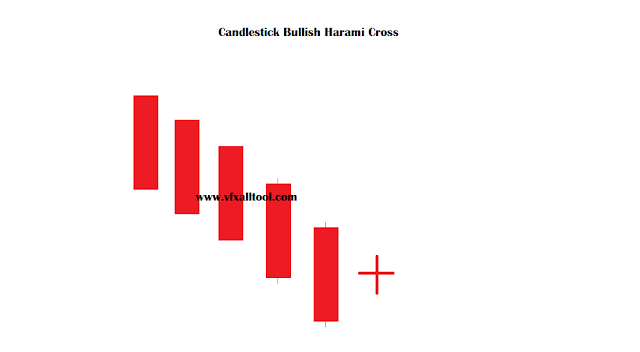
The Bullish Harami Cross Candlestick Pattern consists of two red candlesticks that have long bars, and a Doji candlestick. To understand more about the Bullish Harami Cross Candlestick pattern, let's look at the following picture below this.
 |
| Bullish Harami Cross Candlestick image |
The image above shows a Bullish Harami Cross Candlestick pattern giving a reversal signal. We can seeThe the Bullish Harami Cross candlestick pattern is formed after a long (Bearish) trend. Candlestick pattern The Bullish Harami Cross is formed by a red candlestick that has a long bar, and a Doji candlestick that has the same length top and bottom tail. The Doji candlestick forms a sign (cross), let's assume that the candlestick pattern occurs or is formed within the daily timeframe.
On the first day, a red candlestick is formed which has a long bar. This means telling us that Bearish candlesticks still dominate the price of a market. We haven't seen any significant resistance from the candlestick Bullish. And we can predict that the Bearish candlestick will still dominate the price for the next day. Fortunately, what we predicted was proven wrong, it turns out that the next day what happened was that a Doji candlestick appeared.
The Doji candlestick is in the middle if we look at the first day's candlestick. We look at the opening price, The lowest price, the closing price, and the high price are all enclosed by a first-day candlestick. This means telling us that at the start of a price battle, a Bullish candlestick can dominate the price of a market.
Of course, if we look at the end of the price battle alone, we can't be sure and predict the outcome next price battle. However, if we combine it with what happened on the first day of the candlestick The bulls look to be advancing in the end. It means that the Bullish candlestick is strengthening, while the strength of the candlestick of The bears is weakening. Bullish candlesticks will dominate the price in the future.
Since in the last position it still has the same power, it could happen and there is still a high possibility that this is a bearish candlestick that can dominate the price going forward. So, it is necessary to confirm first that the candlestick Bullish has really controlled the price of a market before we make a purchase in the trade.
The picture below is a picture of the bullish Harami Cross candlestick confirmation
 |
| Candlestick Bullish Harami Cross confirmation |
In the picture above as we can see, a long blue candlestick has been added and a confirmation line which has black color. The blue candlestick looks to have penetrated above the confirmation line. This means telling us that the Bullish candlestick has completely dominated the price of a market and managed to hit the bearish candlestick retreat. Here we have a strong confirmation that the Bullish candlestick will dominate the market price in the following days, the price of a stock will continue to rise and a signal to buy can be done.
Thus the Forex Trading Strategy Using Bullish Harami Cross Candlestick Analysis, you can learn this strategy and understand it first on your demo account, whether it's forex or binary options. Remember trading forex or binary options has a very high risk, do not trade if you are not ready to bear the risk.
Post a Comment for "Forex Trading Strategy Using Bullish Harami Cross Candlestick Analysis"