How to Use TradingView to Analyze the Crypto Market
What is TradingView?
TradingView is a browser-based price chart and social trading platform, which can be used for various types of assets in the financial market, including cryptocurrencies that are already widely known by traders.
How to Use TradingView to Analyze the Crypto Market
The following are the first steps that must be done how to use TradingView.
- Enter the name of the pair of instruments that we will analyze.
- then after that will appear all the products related to the keywords you enter, (such as the image below) for example.
 |
| Symbol search |
If you are still a beginner in this regard, here are the tools for crypto trading that you can use.
 |
| trading view chart |
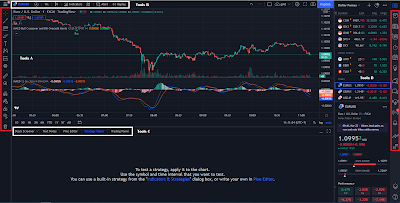
As we see above there are 4 gabions that we need to understand, but you need to know that every TradingView has different desktop views, depending on the owner of the account.
Tools A
This part of the tool has a selection of lines, text, and overplay views that we can directly apply in the chart area.
Tools B
Part of tool B which as you can see in the image above is contains the option to change the appearance of the chart. We can change the look accordingly with our desire and comfort in conducting an analysis of the crypto market.
Tools C
Part of this tool is an option that can connect users of the account with the platform or broker.
Tools D
This tool generally contains to explain the news and functions of TradingView.
From the information above we can conclude that TradingView is an ideal analysis tool that has a function to help us in analyzing the market in trading.
Post a Comment for "How to Use TradingView to Analyze the Crypto Market"